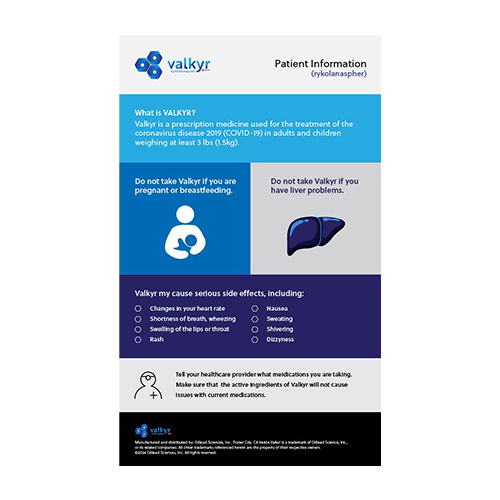
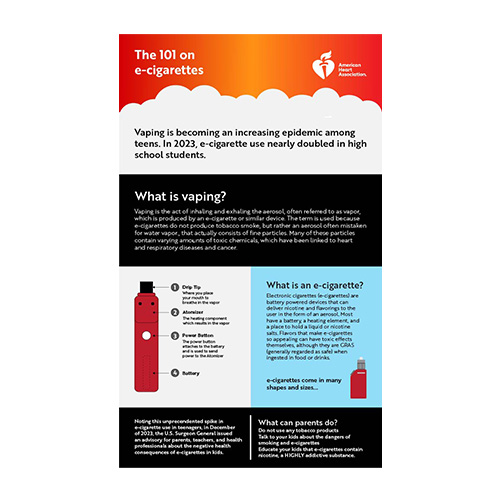
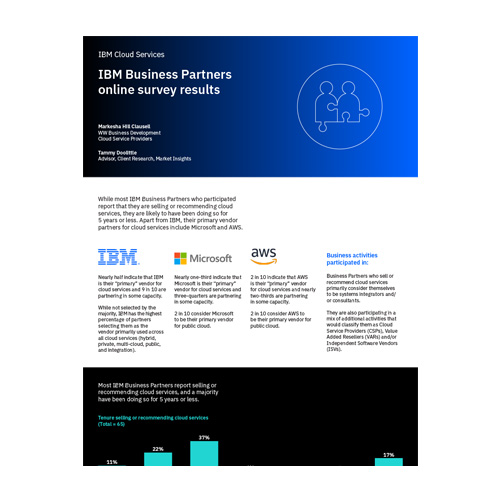
Creating infographics for various client teams always involves a complex design process that balances aesthetics with functionality. The goal is to distill complex information into easily digestible visuals.
Design Complexity
Infographics are powerful tools that transform dense data into engaging visual narratives. The complexity lies in the use of illustrations, icons, charts, tables, and diagrams to represent data, which allows for a significant reduction in textual content. This visual shorthand communicates concepts quickly and effectively, catering to the viewer’s preference for visual learning.
Collaboration and Content Determination
The creation of each infographic was a collaborative effort. Working closely with client teams, I engaged in a thorough understanding of the content to be conveyed. This partnership was crucial in determining not just the content, but also the most impactful way to represent it visually.
User Engagement
I encourage you to view the infographics to fully appreciate the intricate design and the seamless way in which complex information is made accessible. The use of visual elements not only attracts attention but it aids in better retention of the information presented.
Please click the below images to view the full size infographics in PDF format. Thank you in advance for your time and interest in viewing this portfolio.


