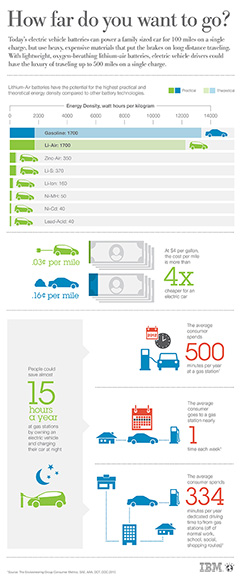
The Electric vehicles infographic was designed for my client at IBM Data Analytics. I worked closely with the client and their team to determine the best way to convey information and statistics regarding the use of lithium-air batteries used in electric vehicles compared to other types of batteries and gas powered automobiles. This infographic is a good example of how illustrations, icons, tables, and diagrams can convey information graphically. Please click the image below to view the entire PDF version of this infographic.
