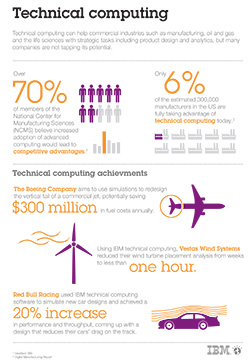
The Technical computing infographic was designed for my client at IBM Watson. The topic of the infographic conveys the percentage of commercial industries and manufacturers who use technical computing to assist with product design and analytics. This infographic was also one of my first projects at IBM. The concept and illustrations were well received by the client and it easily conveys the message to the end-user. This project shows the effectiveness of illustrations and infographics to tell the story. Please click the image below to full the full size infographic.
